Data Visualization Society
Data Experience Lead

How your CV stacks up
Upload your CV to see how well it fits this job role
?%
Full Time
London (Remote)
Posted 3 days ago
Closes: August 8, 2026
Website: infogr8
Data intelligence, beautifully designed
Infogr8 brings data to life in memorable, useful ways, surfacing what is true, making it understandable, and designing it into the moments where decisions happen, across interfaces, communication, and everyday work.
That belief sits behind 14 years of recognised work for organisations including Spotify, Moody’s, Harvard and the World Health Organization, supported by a wider network of specialists across data, design, strategy and technology.
We are looking for a Data Experience Lead to help turn complex evidence into clear stories, visual systems, dashboards, reports and digital experiences people actually use.
This is a hands-on role for someone with the instincts of a data journalist: curious, rigorous, audience-first and comfortable moving between data, story, design and digital delivery. You might come from a newsroom, publisher, data visualisation studio, research organisation, civic tech team or digital product environment.
The opportunity
Clients do not just need beautiful outputs. They need sharper questions, clearer evidence, stronger narratives and better-designed ways for people to understand and act.
This role helps lead that journey from raw information to finished experience, across projects in education, sustainability, health, workforce and public-interest sectors.
The kind of work
You might be turning a research report into a public-facing data story, shaping a dashboard around real audience needs, developing the structure for an interactive microsite, or working with a designer and engineer to make a data product easier to use.
Reasons to use Rodeo
Start with a chat, not a search bar
Grad scheme, placement, apprenticeship? Not sure what you want yet — that's fine. Your agent talks it through with you and turns "I have no idea" into a shortlist.
It searches the market for you
Every day your agent scans the market matching roles against what actually matters to you, not just keywords on a CV.
Only hits
No noise. No "maybe this fits." Just roles with a clear explanation of why they're right — and where to focus when applying.
Some projects will be highly visual. Others will be more strategic, editorial or product-shaped. Most will involve ambiguity, messy material and the need to make something clear without oversimplifying it.
What You’ll Be Trusted With
- Finding the signal – Work through messy files, research outputs, spreadsheets, reports and source material to identify useful patterns, gaps and storylines.
- Shaping the experience – Clarify who the work is for, what they need to understand, and what the output should help them do.
- Bringing editorial judgement – Help decide what matters, what can be cut, what needs more evidence, and how the narrative should unfold.
- Connecting the team – Brief designers, developers, analysts and specialist partners clearly, keeping the thread intact from early thinking to final delivery.
- Raising the craft – Protect accuracy, usability and visual clarity, while using AI and modern tools to speed up research, synthesis and prototyping where useful.
Useful experience
We would be interested in people with experience across some of:
- Data journalism, visual storytelling or data visualisation.
- Dashboards, interactive reports, explainers, microsites or data products.
- Research communication, policy communication, civic tech, UX or content design.
- Data wrangling using Excel, Google Sheets, Python, R, SQL or similar.
- Tools such as Datawrapper, Flourish, RAWGraphs, Observable, Mapbox, Figma or similar.
You do not need to tick every box. The key thing is that you can move confidently between evidence, story and experience.
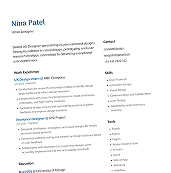
Get help with your application
Your very own career expert that helps elevate your application to the next level.
Good signs this could suit you
- You are comfortable holding the pen on the shape of the work, not just contributing a piece of it.
- You can stitch together clients, data specialists, designers and developers so the final solution feels coherent, not assembled.
- You like making complex things understandable, and you know when to simplify, challenge or reframe.
- You care whether people actually use the thing, not just whether it looks good.
- You can work at pace, protect the rigour, and keep the team moving towards a clear outcome.
- You keep a mental library of great data stories, dashboards, explainers and visual systems.
What You’ll Help Shape
You will help define what great data experience work looks like at infogr8, from better reusable patterns and clearer delivery standards to sharper editorial approaches and smarter ways of using AI across the work.
You will be joining a small team with a trusted specialist network, so your judgement, taste and pace will have a visible impact.
How To Apply
Step one is a short 15-minute culture test. No CV needed yet.
If we’re both still interested, we’ll ask for a short note covering:
- A project where you helped turn complex information into something clearer or more useful.
- Why this opportunity feels interesting now.
- A piece of work you are proud of and why it mattered.
From there, we’ll move to one chemistry call, one working session and a decision inside two weeks.
To apply for this job please visit app.culturetest.com.
“It took my CV and asked me questions relevant to understanding what kind of jobs to suggest for me. Suggestions were almost perfect. Jobs were exactly what I’ve been looking for.”
Jessica, London
Skills
Location