Q1 Technologies, Inc.
UI UX Designer

How your CV stacks up
Upload your CV to see how well it fits this job role
?%
UI/UX Designer
London UK (Wallbrook) Onsite role Contract role
As part of the interview process, we'd like to understand how you approach designing enterprise dashboards for data-rich products. This exercise is intended to evaluate your UX thinking, information architecture, visual hierarchy, and ability to design dashboards that support business decision-making.
This is not a visual design competition—we're more interested in your design decisions than pixel-perfect UI.
Timeline
Please complete and submit the assignment within 2 days. We are not evaluating flashy UI or pixel-perfect visuals; instead, we are looking for your UX thinking, information architecture, data visualization choices, and overall problem-solving approach.
Brief
A large B2B SaaS company currently relies on multiple Excel reports to monitor its sales performance.
Reasons to use Rodeo
Start with a chat, not a search bar
Grad scheme, placement, apprenticeship? Not sure what you want yet — that's fine. Your agent talks it through with you and turns "I have no idea" into a shortlist.
It searches the market for you
Every day your agent scans the market matching roles against what actually matters to you, not just keywords on a CV.
Only hits
No noise. No "maybe this fits." Just roles with a clear explanation of why they're right — and where to focus when applying.
Every morning, Sales Directors spend nearly an hour opening different reports to answer questions like:
- How is revenue performing?
- Which regions are underperforming?
- Which products are driving growth?
- Which sales representatives need attention?
- What deals are at risk?
- Which customers contribute most to revenue?
The company has decided to consolidate all reporting into a single analytics dashboard that will eventually be implemented in Power BI.
Your task is to design this dashboard experience.
Data
You may make reasonable assumptions where required
- Total Revenue
- Revenue vs Target
- Monthly Trend
- Top 10 Customers
- Product Performance
- Region-wise Sales
- Salesperson Performance
- Pipeline Stage
- Win Rate
- Lost Deals
- Customer Segment
Expected Deliverables
Design one desktop dashboard that effectively communicates business performance.
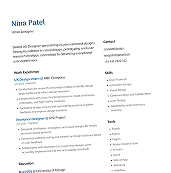
Get help with your application
Your very own career expert that helps elevate your application to the next level.
Your solution should include:
- Persona & User flow
- Identify the key user pain points and explain how your proposed solution addresses them.
- Low-fidelity wireframe
- High-fidelity dashboard
- Design rationale (1 page)
The dashboard design should include:
- KPI summary
- Charts
- Tables
- Filters
- Meaningful hierarchy
- Navigation (if required)
Evaluation Criteria
We are looking for:
- Problem understanding and approach
- Information hierarchy
- KPI prioritization
- Drill-down thinking
- Decision-making support
- Understanding of accessibility (WCAG)
NOT just beautiful UI.
There is no single correct answer.
Submission Guidelines
Please submit:
- Figma link (preferred) or PDF
- Any supporting notes
Keep it concise and impactful.
Looking forward to seeing your creative solutions! 🚀
“It took my CV and asked me questions relevant to understanding what kind of jobs to suggest for me. Suggestions were almost perfect. Jobs were exactly what I’ve been looking for.”
Jessica, London
Skills
Location